Full walkthrough with OpenTelemetry and Python in Kubernetes.
Introduction
Following up on my last article about creating metrics for your microservice, I thought it may be interesting to show an overview on how you can centralize observability in your Kubernetes cluster.
This article will explain different ways of publishing telemetry depending on your service.
All source code can be found in this repository.
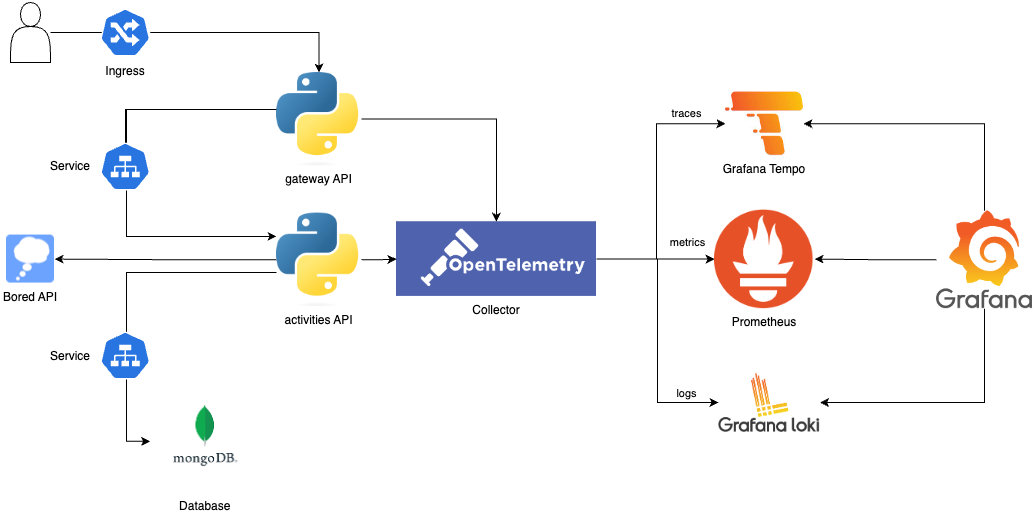
Architecture
The collector allows receiving data, process it and export it. It creates an interface, making a seamless connection to different exporters.
The two Python services make use of this endpoint by an environment variable, rather than configuring every backend individually.
Observability
This component allows better scalability than sending telemetry data directly to a backend. At the same time, it offers vendor-agnostic implementation on how to receive, process and export telemetry data.

In this example, the collector enables the OTLP protocol as the only receiver.
  receivers:
    otlp:
      protocols:
        grpc:
          endpoint: ${env:MY_POD_IP}:4317
and has the following exporters configured:
  exporters:
    otlp:
      endpoint: tempo-distributor:4317

    loki:
      endpoint: http://loki-distributed-gateway/loki/api/v1/push

    otlphttp/prometheus:
      endpoint: http://kube-prometheus-stack-prometheus:9090/api/v1/otlp
Finally, we can create our telemetry pipeline, where it enables receivers, processors and exporters.
Tempo will receive traces, Prometheus will receive metrics and Loki will receive logs.
Grafana will combine all these 3 and configure them accordingly to link traces to logs and metrics accordingly.
Python services
The activities API will get an activity from an external API, save it to a database, and return it to the Gateway API.
The Gateway API is exposed by an Ingress under http://gateway.localhost, which automatically gives us metrics
thanks to the Nginx controller. However, our backend Activities API is not exposed, so we create the metrics
ourselves.
Both services are configured to send data to the OT Collector.
Traces
The microservices are running with Flask, so we are using FlaskInstrumentor class to collect traces
of the endpoints being hit. At the same time, we use RequestsInstrumentor class to collect traces made by
the requests library.
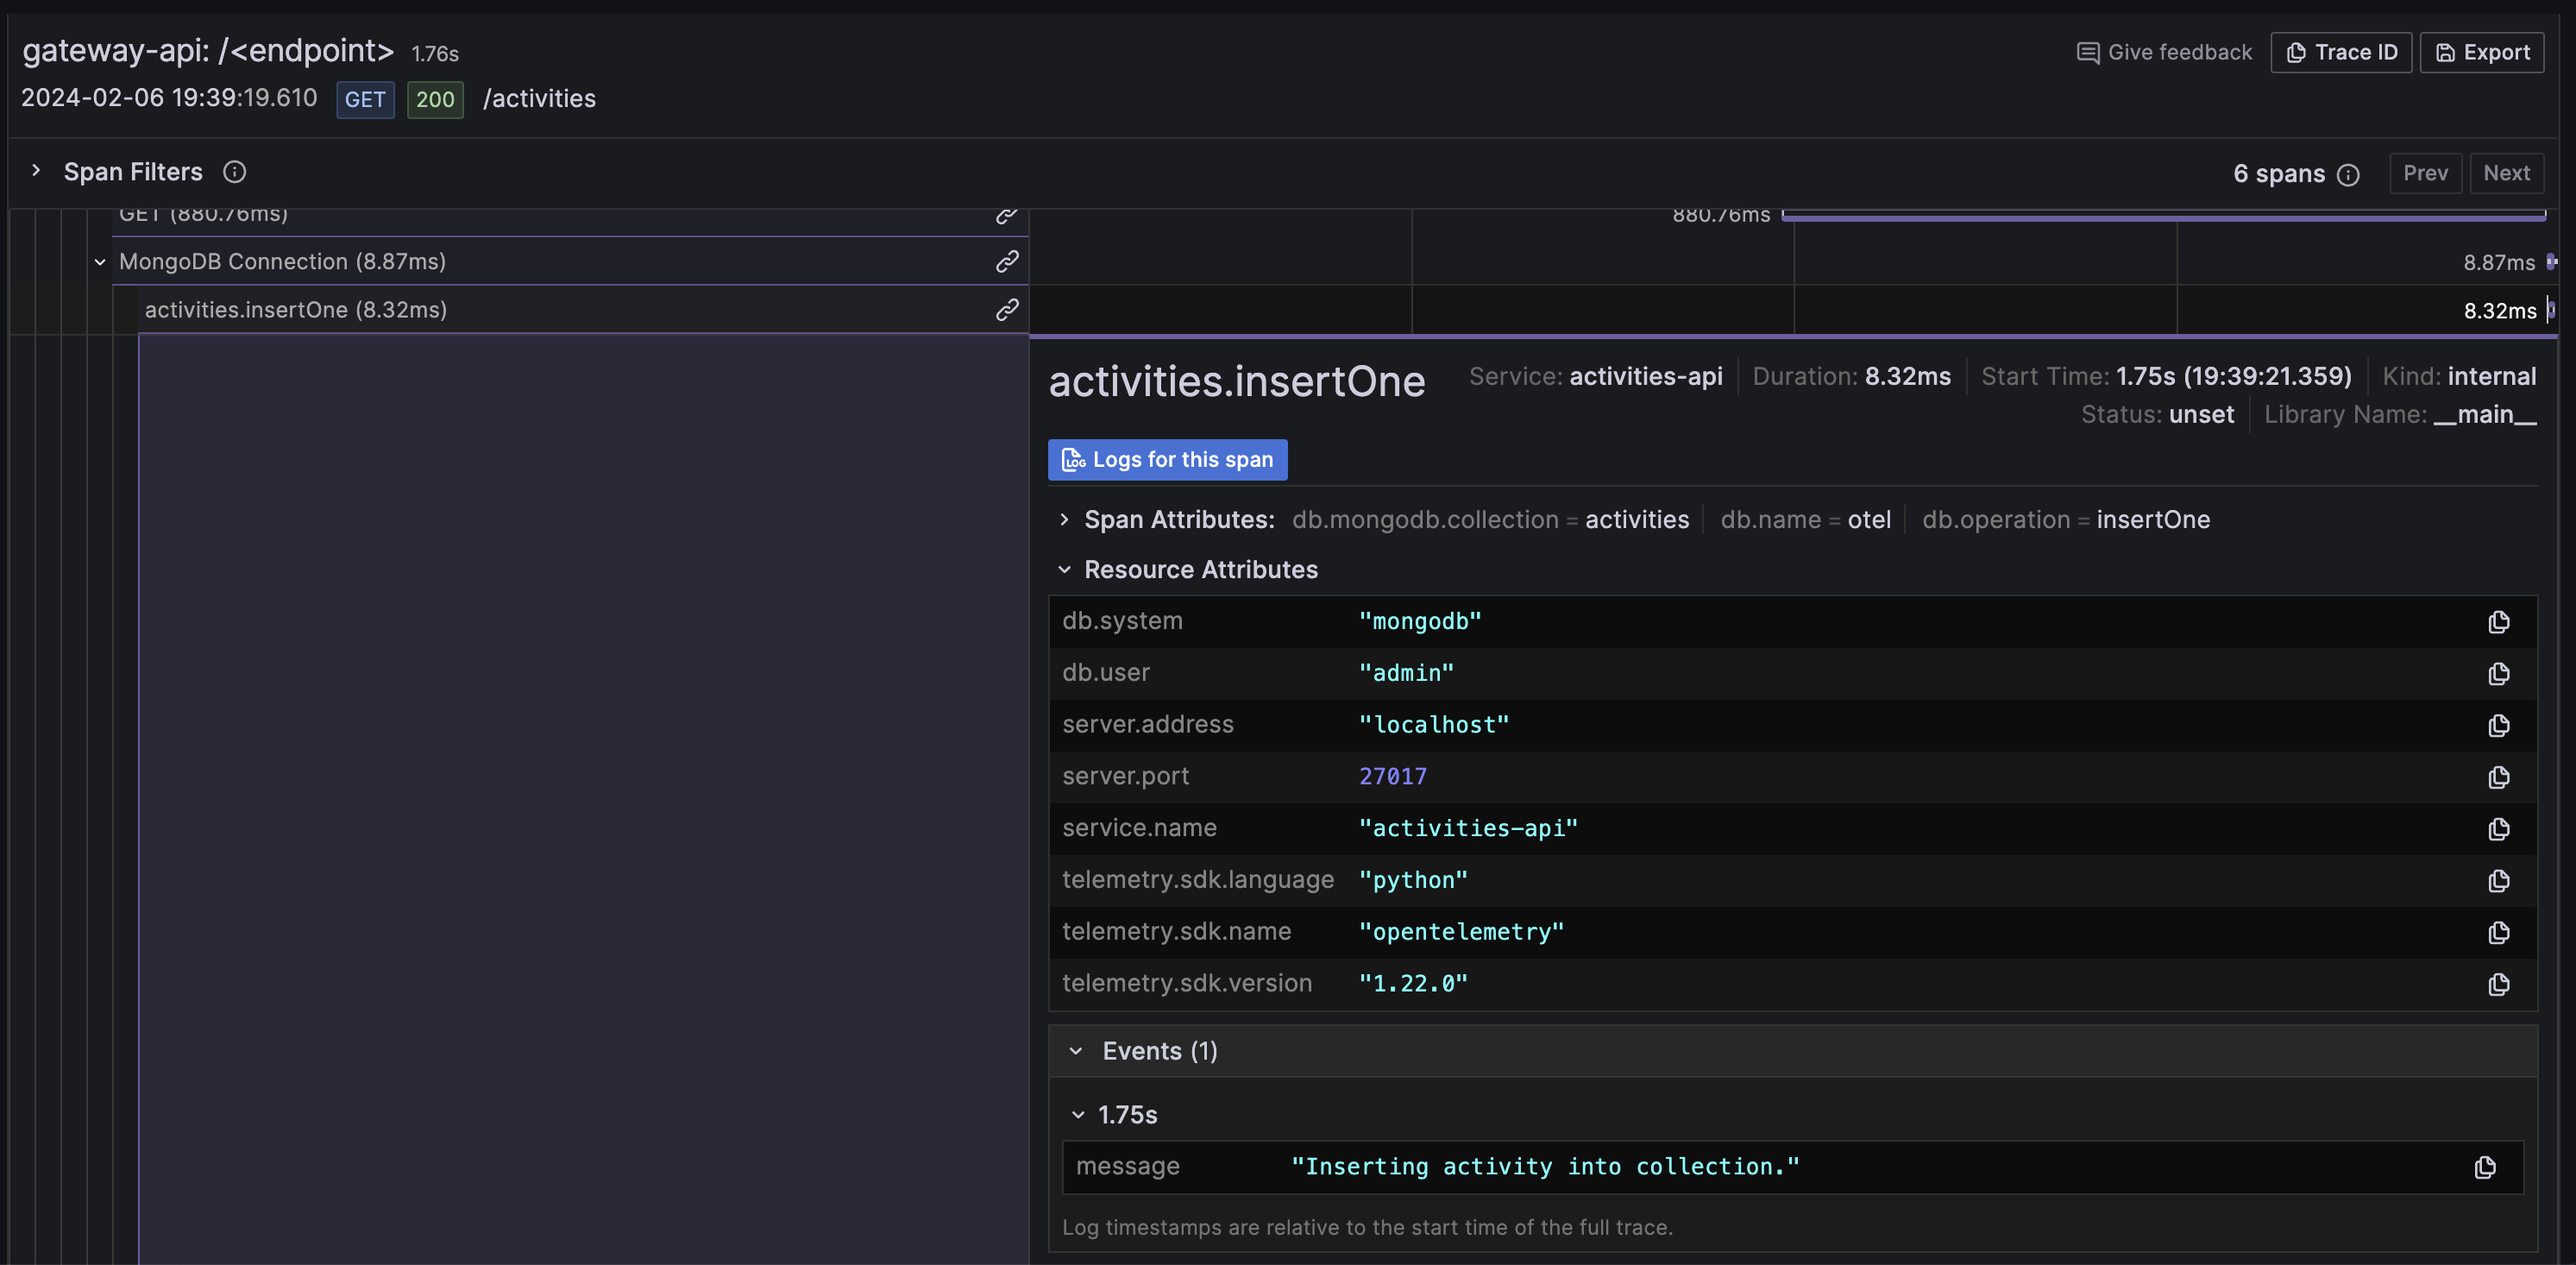
Since we are doing operations with a database with PyMongo, we need to manually create new spans in the current trace as well as add more attributes and exceptions in the span in case errors arise.
with tracer.start_as_current_span("MongoDB Connection"):
otel_db = client.otel
activities_collection = otel_db.activities
with tracer.start_as_current_span("activities.insertOne"):
current_span = trace.get_current_span()
current_span.add_event("Inserting activity into collection.")
current_span.set_attribute(
SpanAttributes.DB_MONGODB_COLLECTION, "activities"
)
current_span.set_attribute(SpanAttributes.DB_NAME, "otel")
current_span.set_attribute(SpanAttributes.DB_OPERATION, "insertOne")
activity = activities_collection.insert_one(response.json()).inserted_id
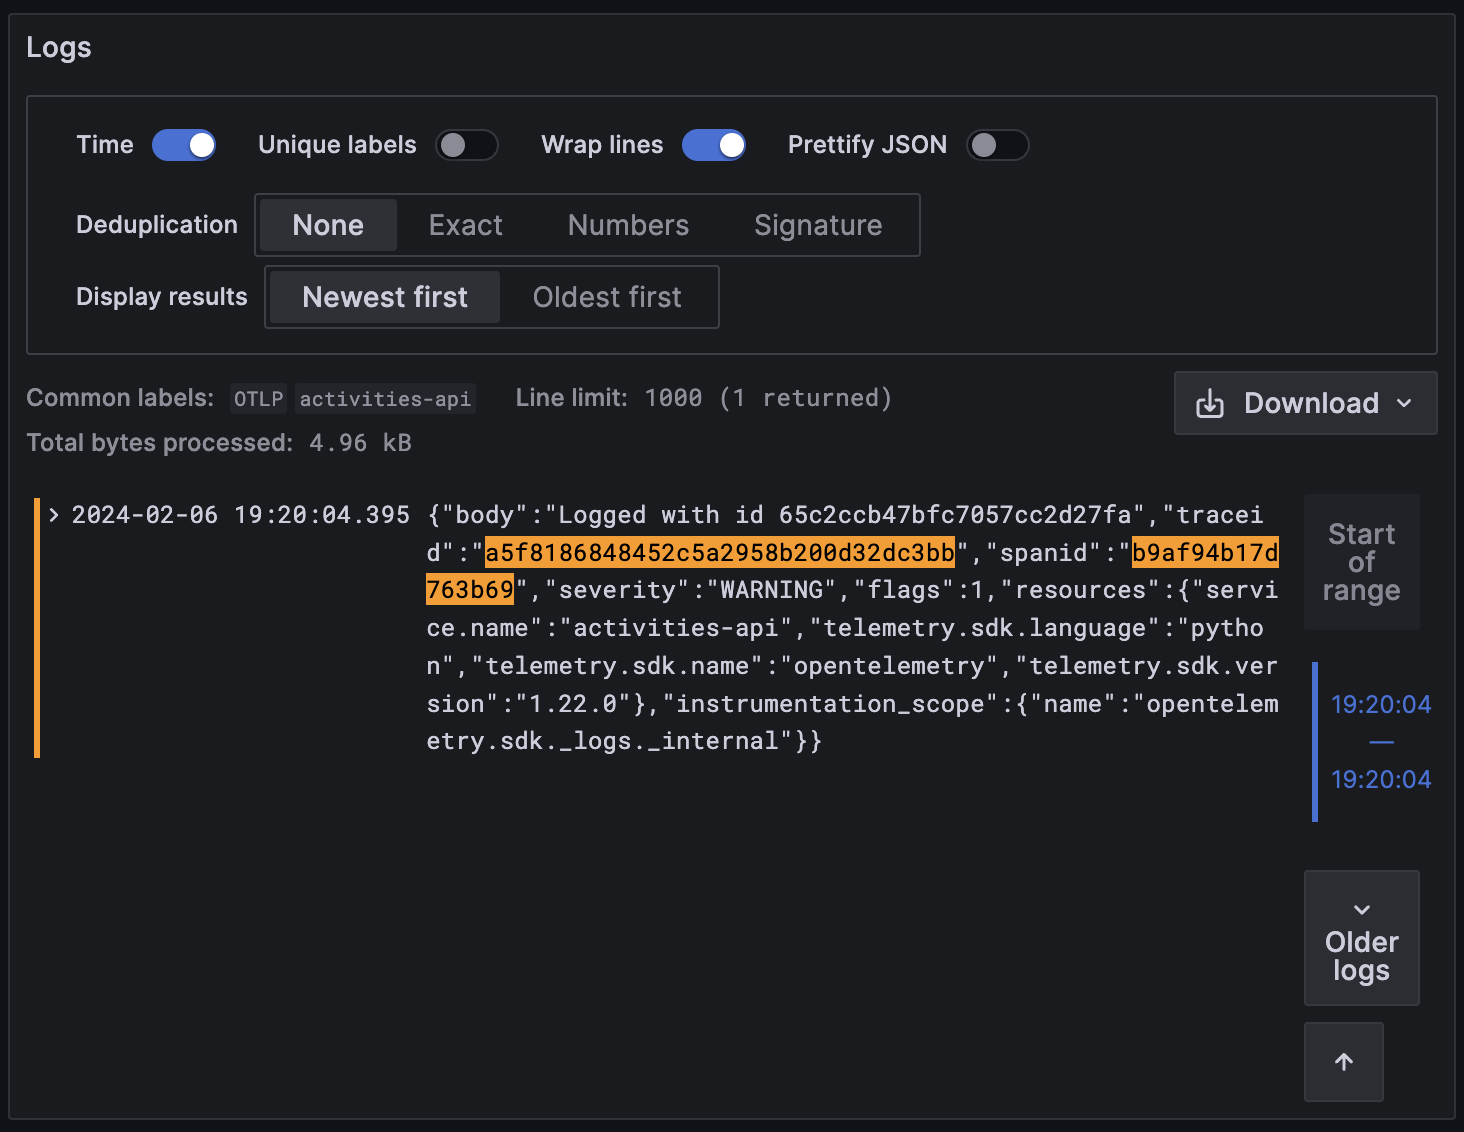
logger.warning(f"Logged with id {activity}")
All traces are sent to the collector and exported to Grafana Tempo.
Metrics
Nginx controller collects all Ingress requests, so it's handy for us to have histograms ready that Prometheus
scrapes.
However, for our Activities API, since we need to create our own metrics, we have to export them somewhere.
There are different ways of doing so, but in this example we are trying the OTLP receiver feature in Prometheus, so it
that can receive OpenTelemetry format metrics.
So we only need to instrument our code to send metrics to the OTLP receiver.
ACTIVITIES_API_DURATION_HISTOGRAM = meter.create_histogram(
    "activities_api_duration", unit="ms", description="Duration of request."
)

duration_milliseconds = round((datetime.now() - start_time).total_seconds() * 1000)

ACTIVITIES_API_DURATION_HISTOGRAM.record(
    duration_milliseconds, {"status_code": response.status_code}
)
We configured Grafana to get metrics based on Nginx controller that will be linked to the trace.
tracesToMetrics:
datasourceUid: prometheus
spanStartTimeShift: '1h'
spanEndTimeShift: '-1h'
tags: [ { key: 'http.host', value: 'host' } ]
queries:
- name: success rate
query: |
(sum(rate(nginx_ingress_controller_requests{status=~"2..", $$__tags}[1m])) by (ingress,cluster))
/
(sum(rate(nginx_ingress_controller_requests[1m])) by (ingress) * 100 > 5)
- name: p95 latency
query: |
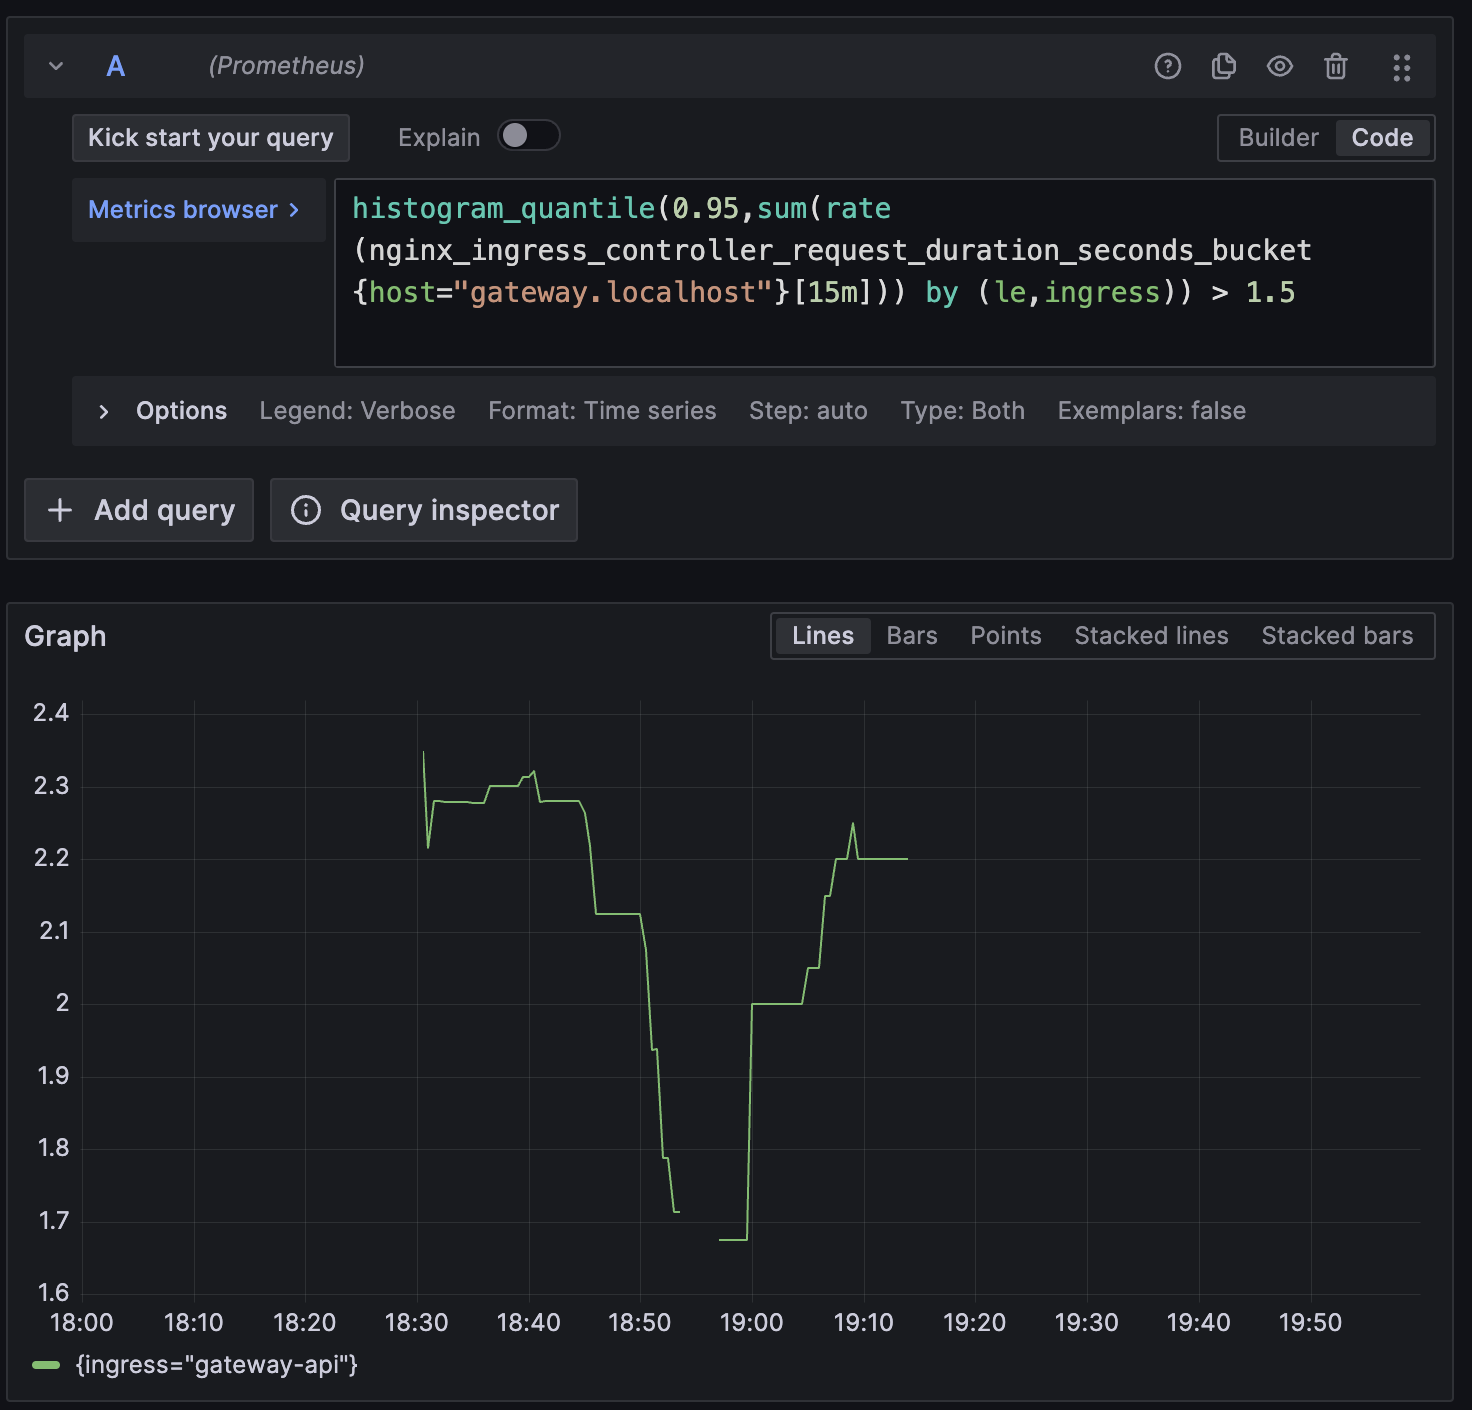
histogram_quantile(0.95,sum(rate(nginx_ingress_controller_request_duration_seconds_bucket{$$__tags}[15m])) by (le,ingress)) > 1.5
- name: error rate
query: |
(sum(rate(nginx_ingress_controller_requests{status=~'5..', $$__tags}[1m])) by (ingress,cluster))
/
(sum(rate(nginx_ingress_controller_requests[1m])) by (ingress) * 100 > 5)
Logs
Rather than having an external service like Promtail parsing the filesystem logs and send them to Loki, I wanted to show you another way of handling everything with the collector.
We initialize the OpenTelemetry logger provider with its exporter, so then we can use it as we normally would.
def setup_logging():
    logger_provider = LoggerProvider()
    set_logger_provider(logger_provider)

    otlp_log_exporter = OTLPLogExporter(
        endpoint=os.environ.get("OTEL_EXPORTER_OTLP_ENDPOINT"), insecure=True
    )
    logger_provider.add_log_record_processor(BatchLogRecordProcessor(otlp_log_exporter))
    handler = LoggingHandler(level=logging.NOTSET, logger_provider=logger_provider)
    logging.getLogger().addHandler(handler)

    logger = logging.getLogger(__name__)
    return logger

logger = setup_logging()
logger.info("Getting an activity")
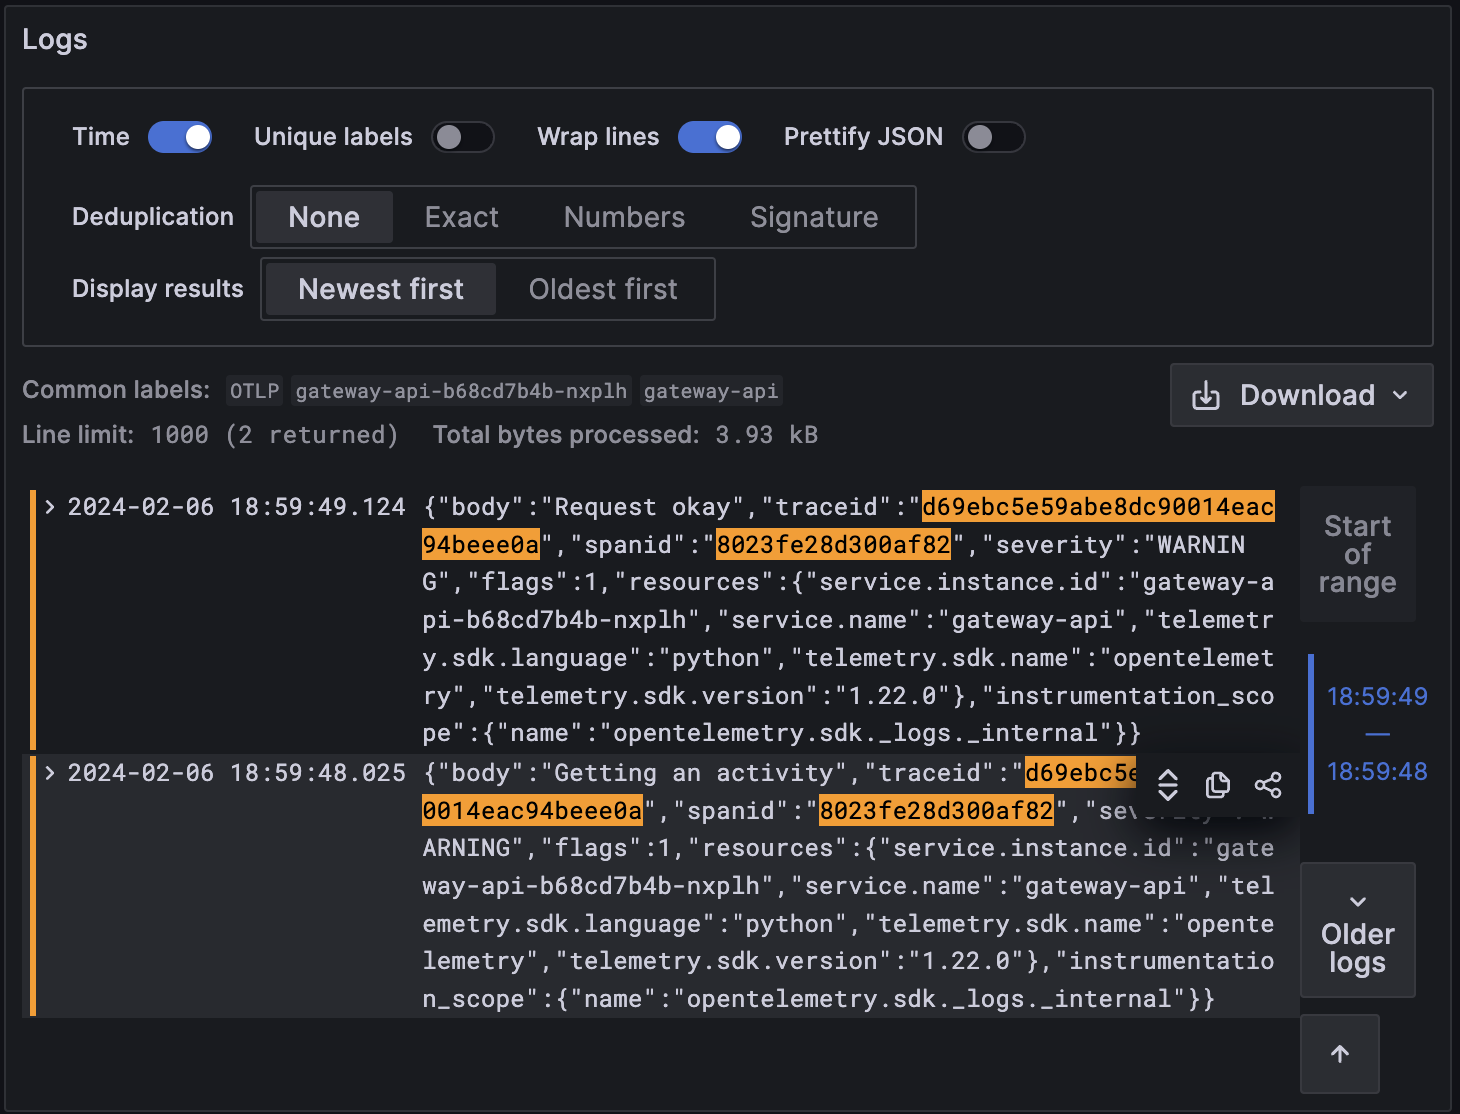
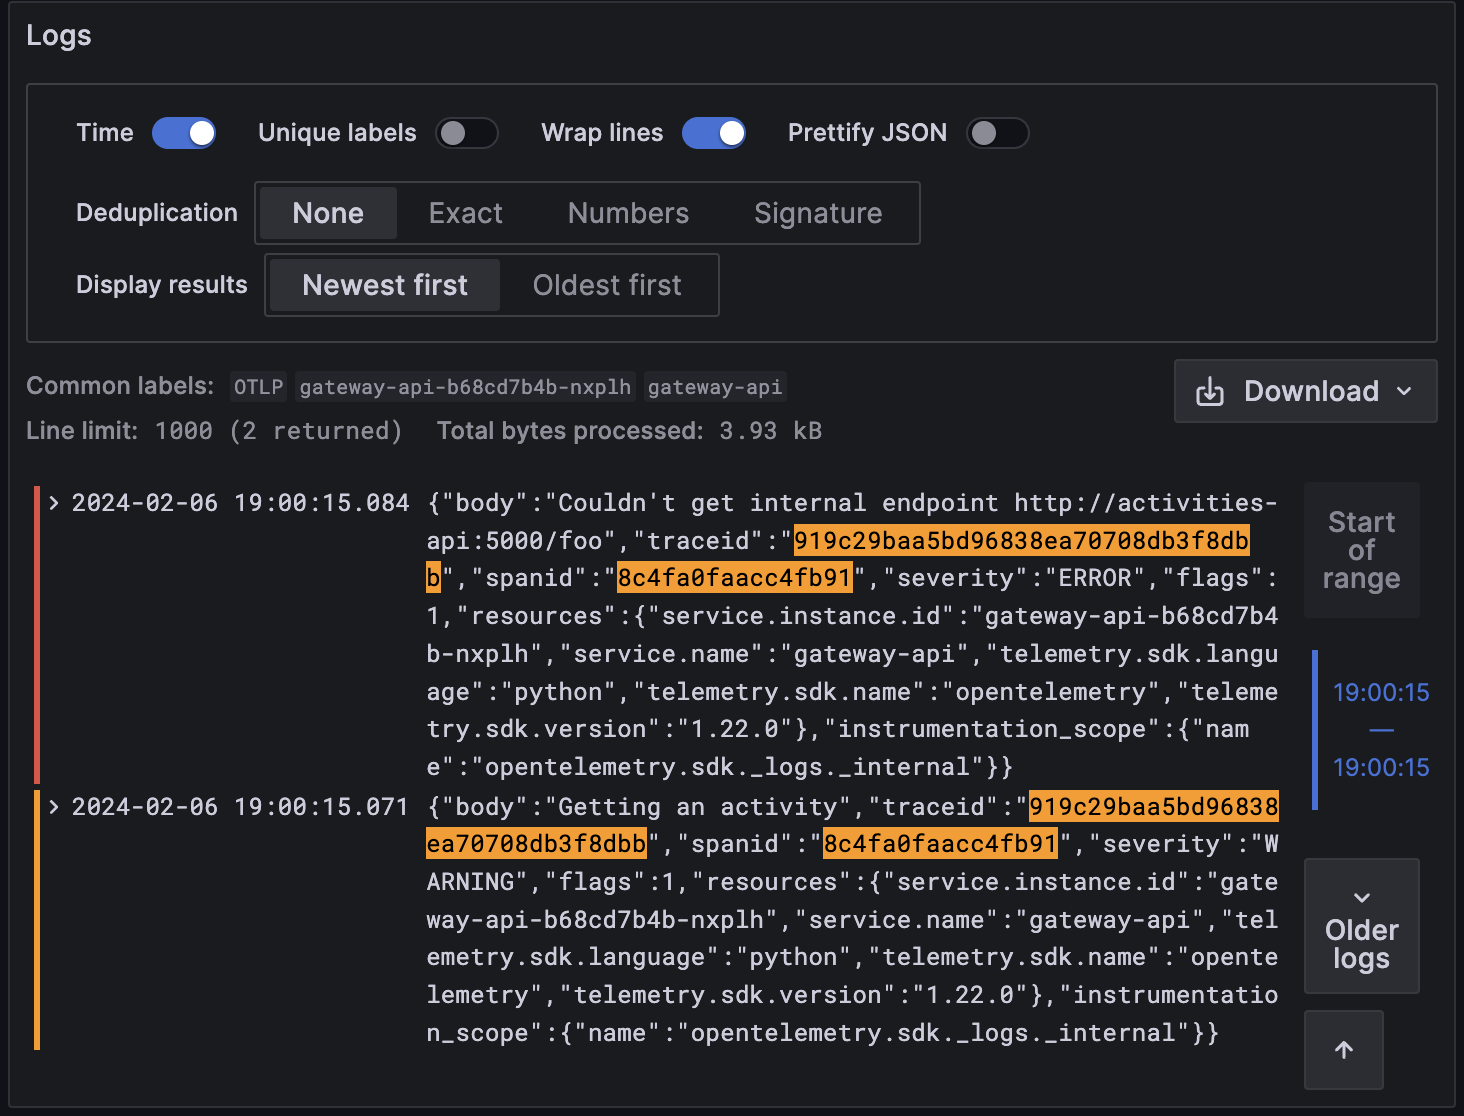
Grafana is configured to get logs based on the traceId which makes it very handy.
tracesToLogsV2:
  datasourceUid: loki
  spanStartTimeShift: '1h'
  spanEndTimeShift: '-1h'
  filterByTraceID: true
  filterBySpanID: true
  tags: [ {key: 'service.name', value: 'job'} ]
Python OpenTelemetry's logging SDK is still in experimental state.
Deployment
In this case, we are using a k3s cluster with an image registry to push images to and skaffold to build
the source code and deploy all the manifests.
You can create the cluster and deploy all the infrastructure as per below.
$ cd infra/
$ k3d cluster create --config=k3d-config.yaml
$ skaffold run
After a few minutes, you should have all the infrastructure running. Similarly, for the applications:
$ cd apps/
$ skaffold run
Demo
Open a browser and get an activity http://gateway.localhost/activities. You should see a JSON similar to:
{"activity":{"accessibility":0.5,"activity":"Prepare a 72-hour kit","key":"4266522","link":"https://www.ready.gov/kit","participants":1,"price":0.5,"type":"busywork"},"status":200}
Now, to go deep into observability, we have to go to http://grafana.localhost/ and click on the Explore tab. If you search
for traces, you should see it.
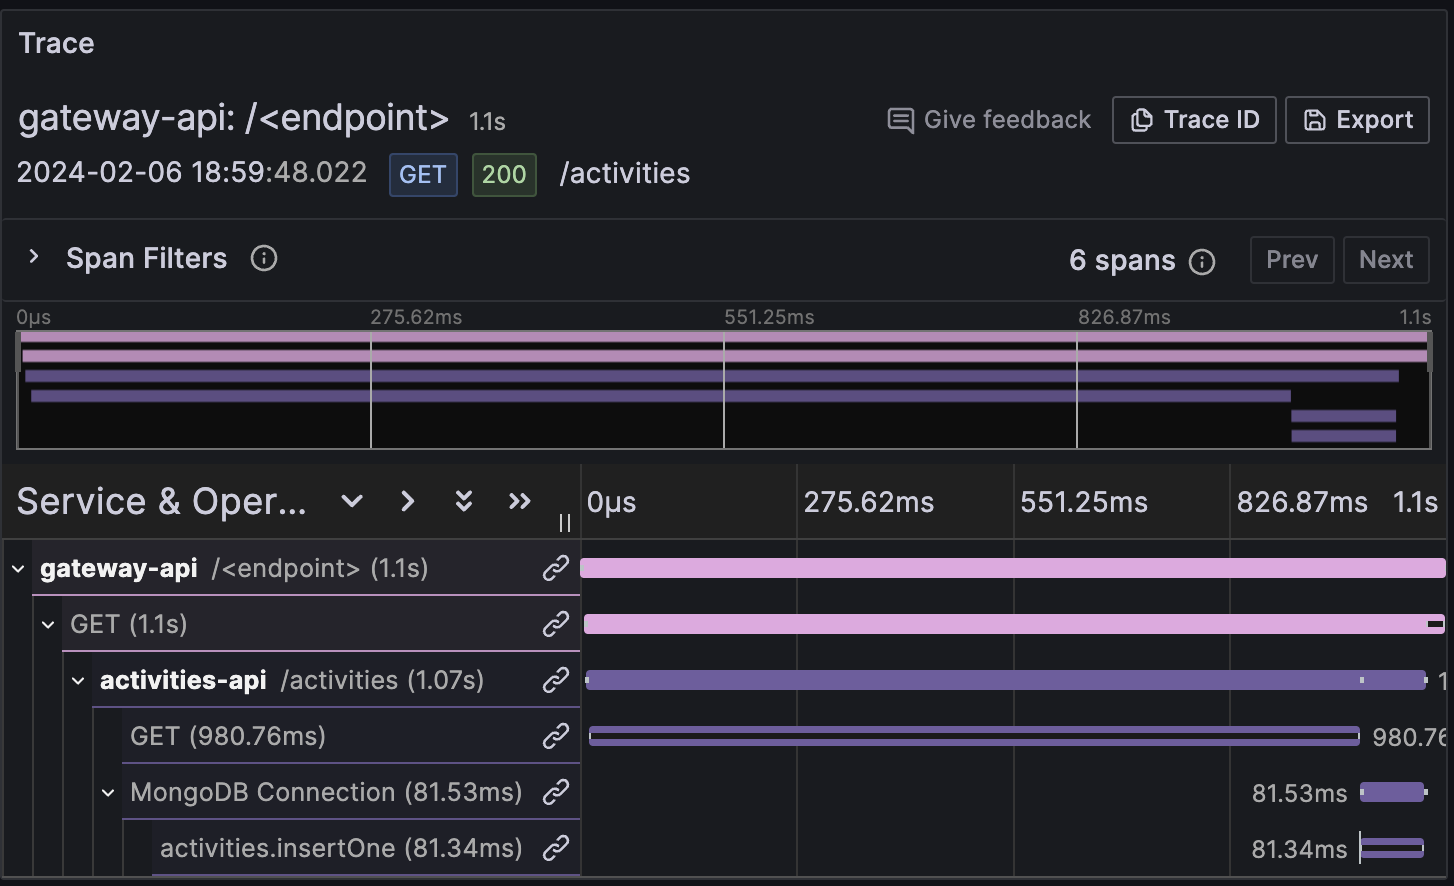
We can click on any span to see its attributes and events. For example, our Database insert.
Every span has a link icon that will show what queries are enabled for the tracesToMetrics and tracesToLogsV2 features.
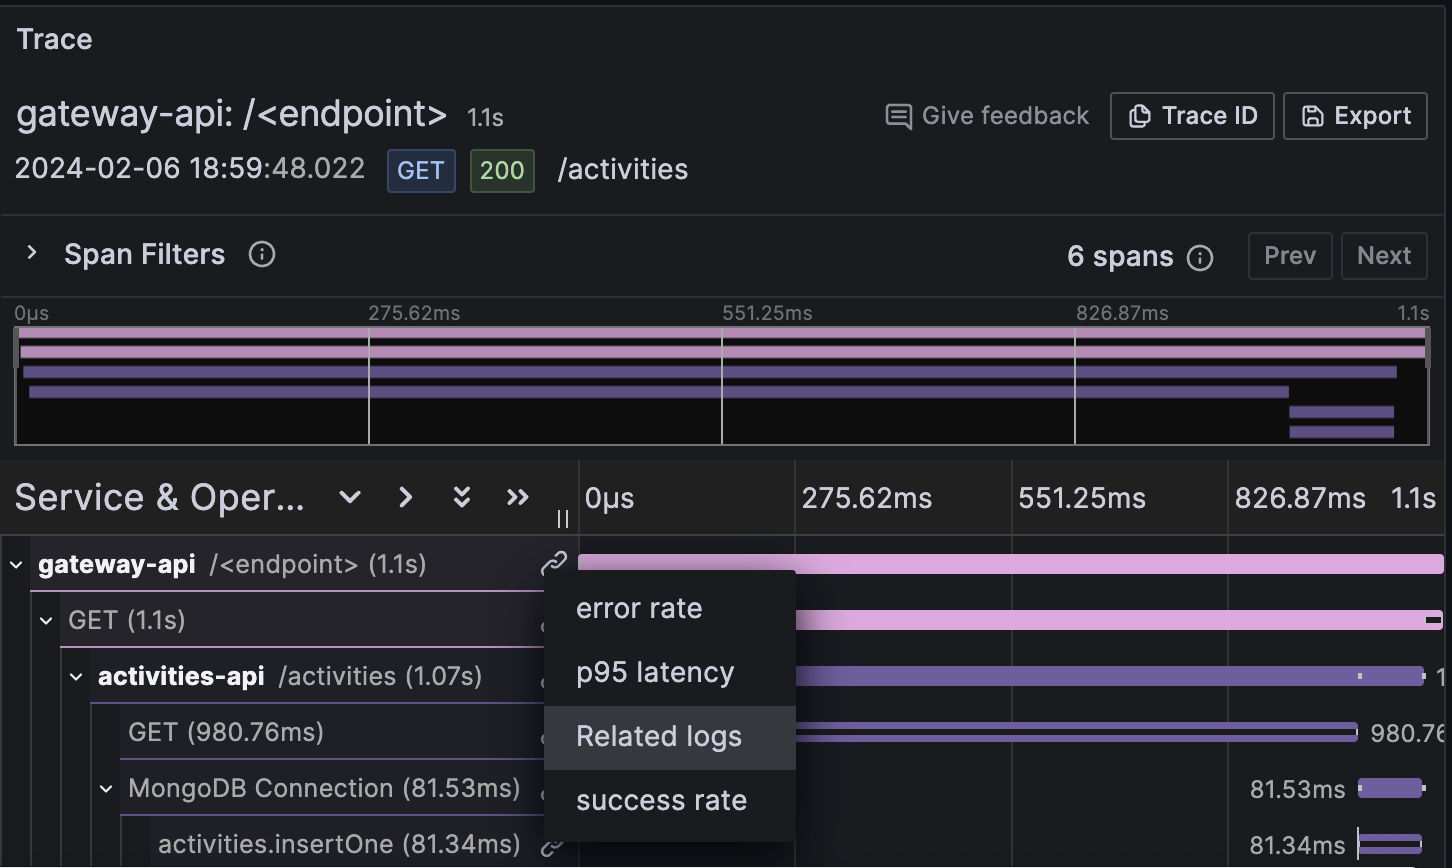
By clicking on p95 latency we will see the 95 percentile of our gateway requests.
And the logs as well, for both Gateway and Activities API
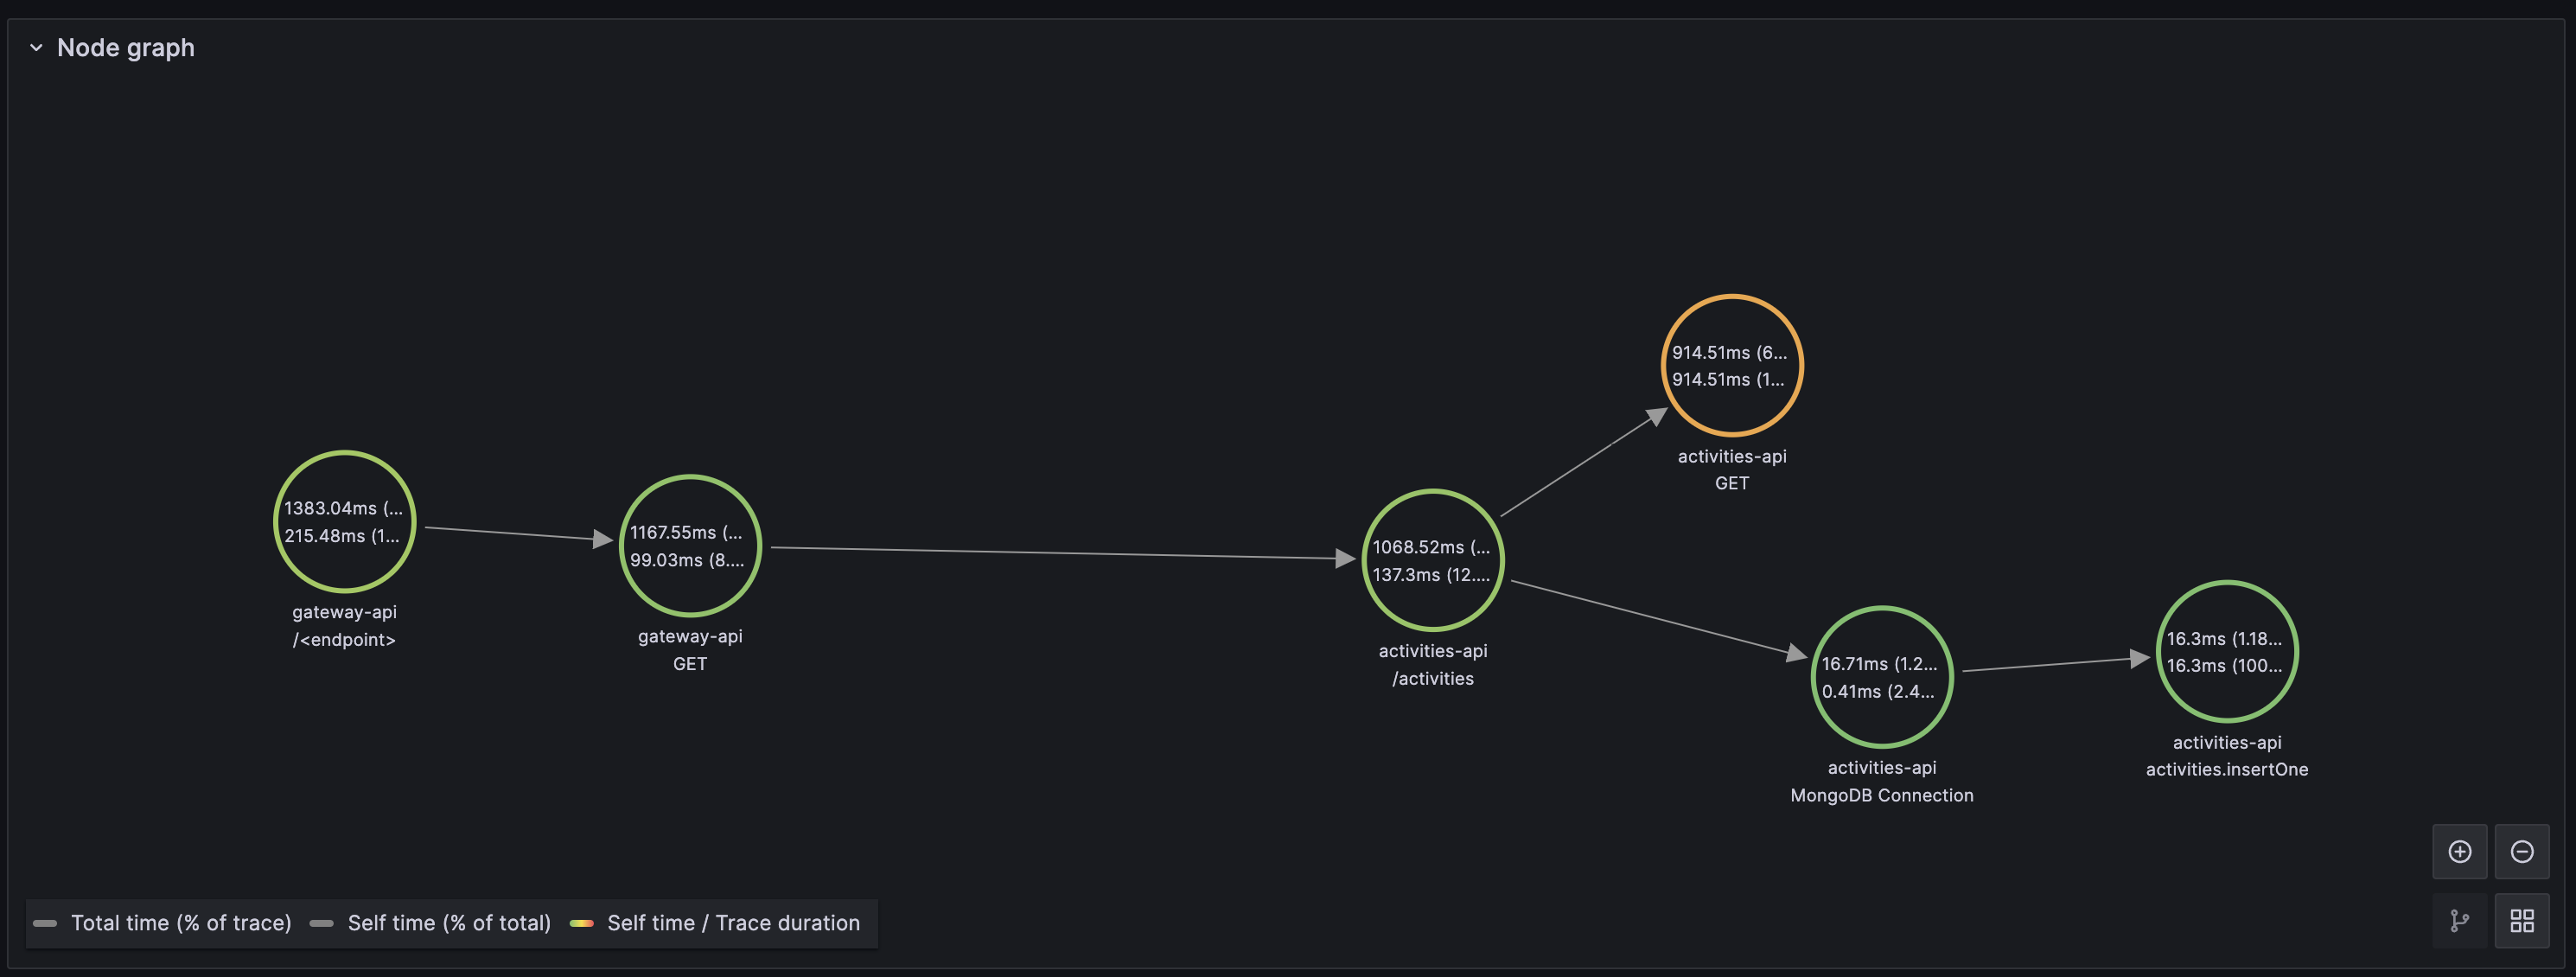
Finally, Grafana is also configured to create a node graph for our services, which is quite visual.
Now, our code is also configured to capture exceptions and errors. The code is designed to raise an exception if the
Gateway endpoint is foo. Let's test it.
Get back to the browser and hit http://gateway.localhost/foo. You should see a 500 error message.
If we search for traces again, we should see one containing an error. By clicking on it, we can see the Traceback error and the message that we added.
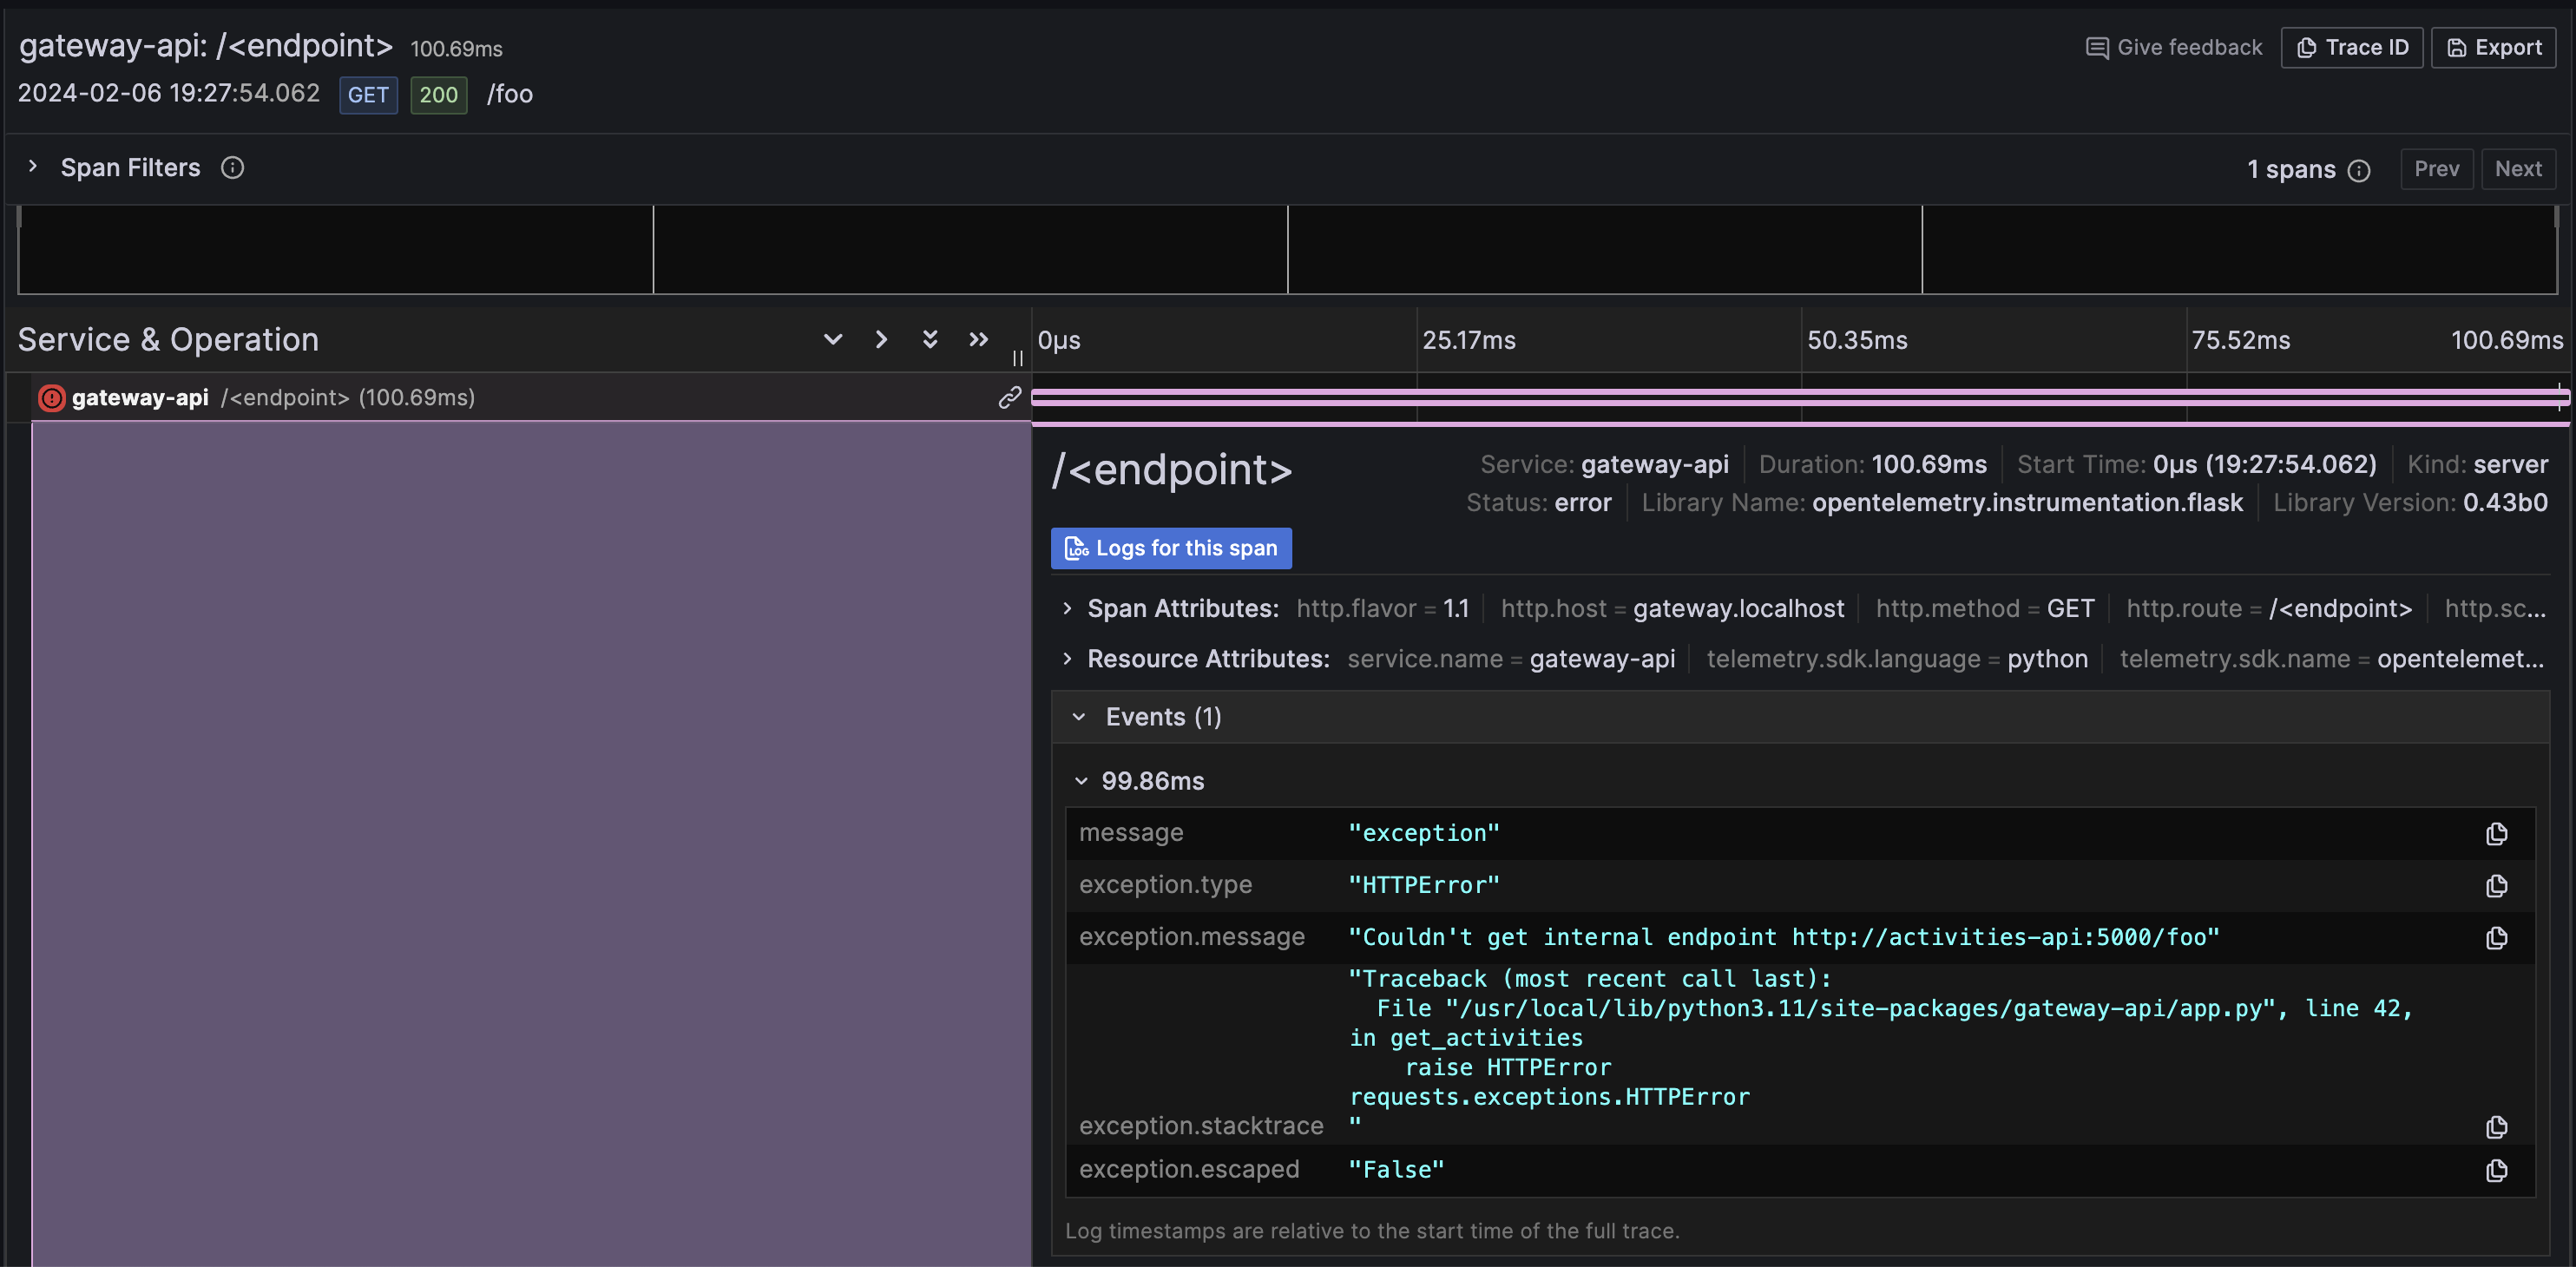
If we wanted to elaborate more based on logs, we can also trace it back easily by clicking "Logs for this span" on the trace.
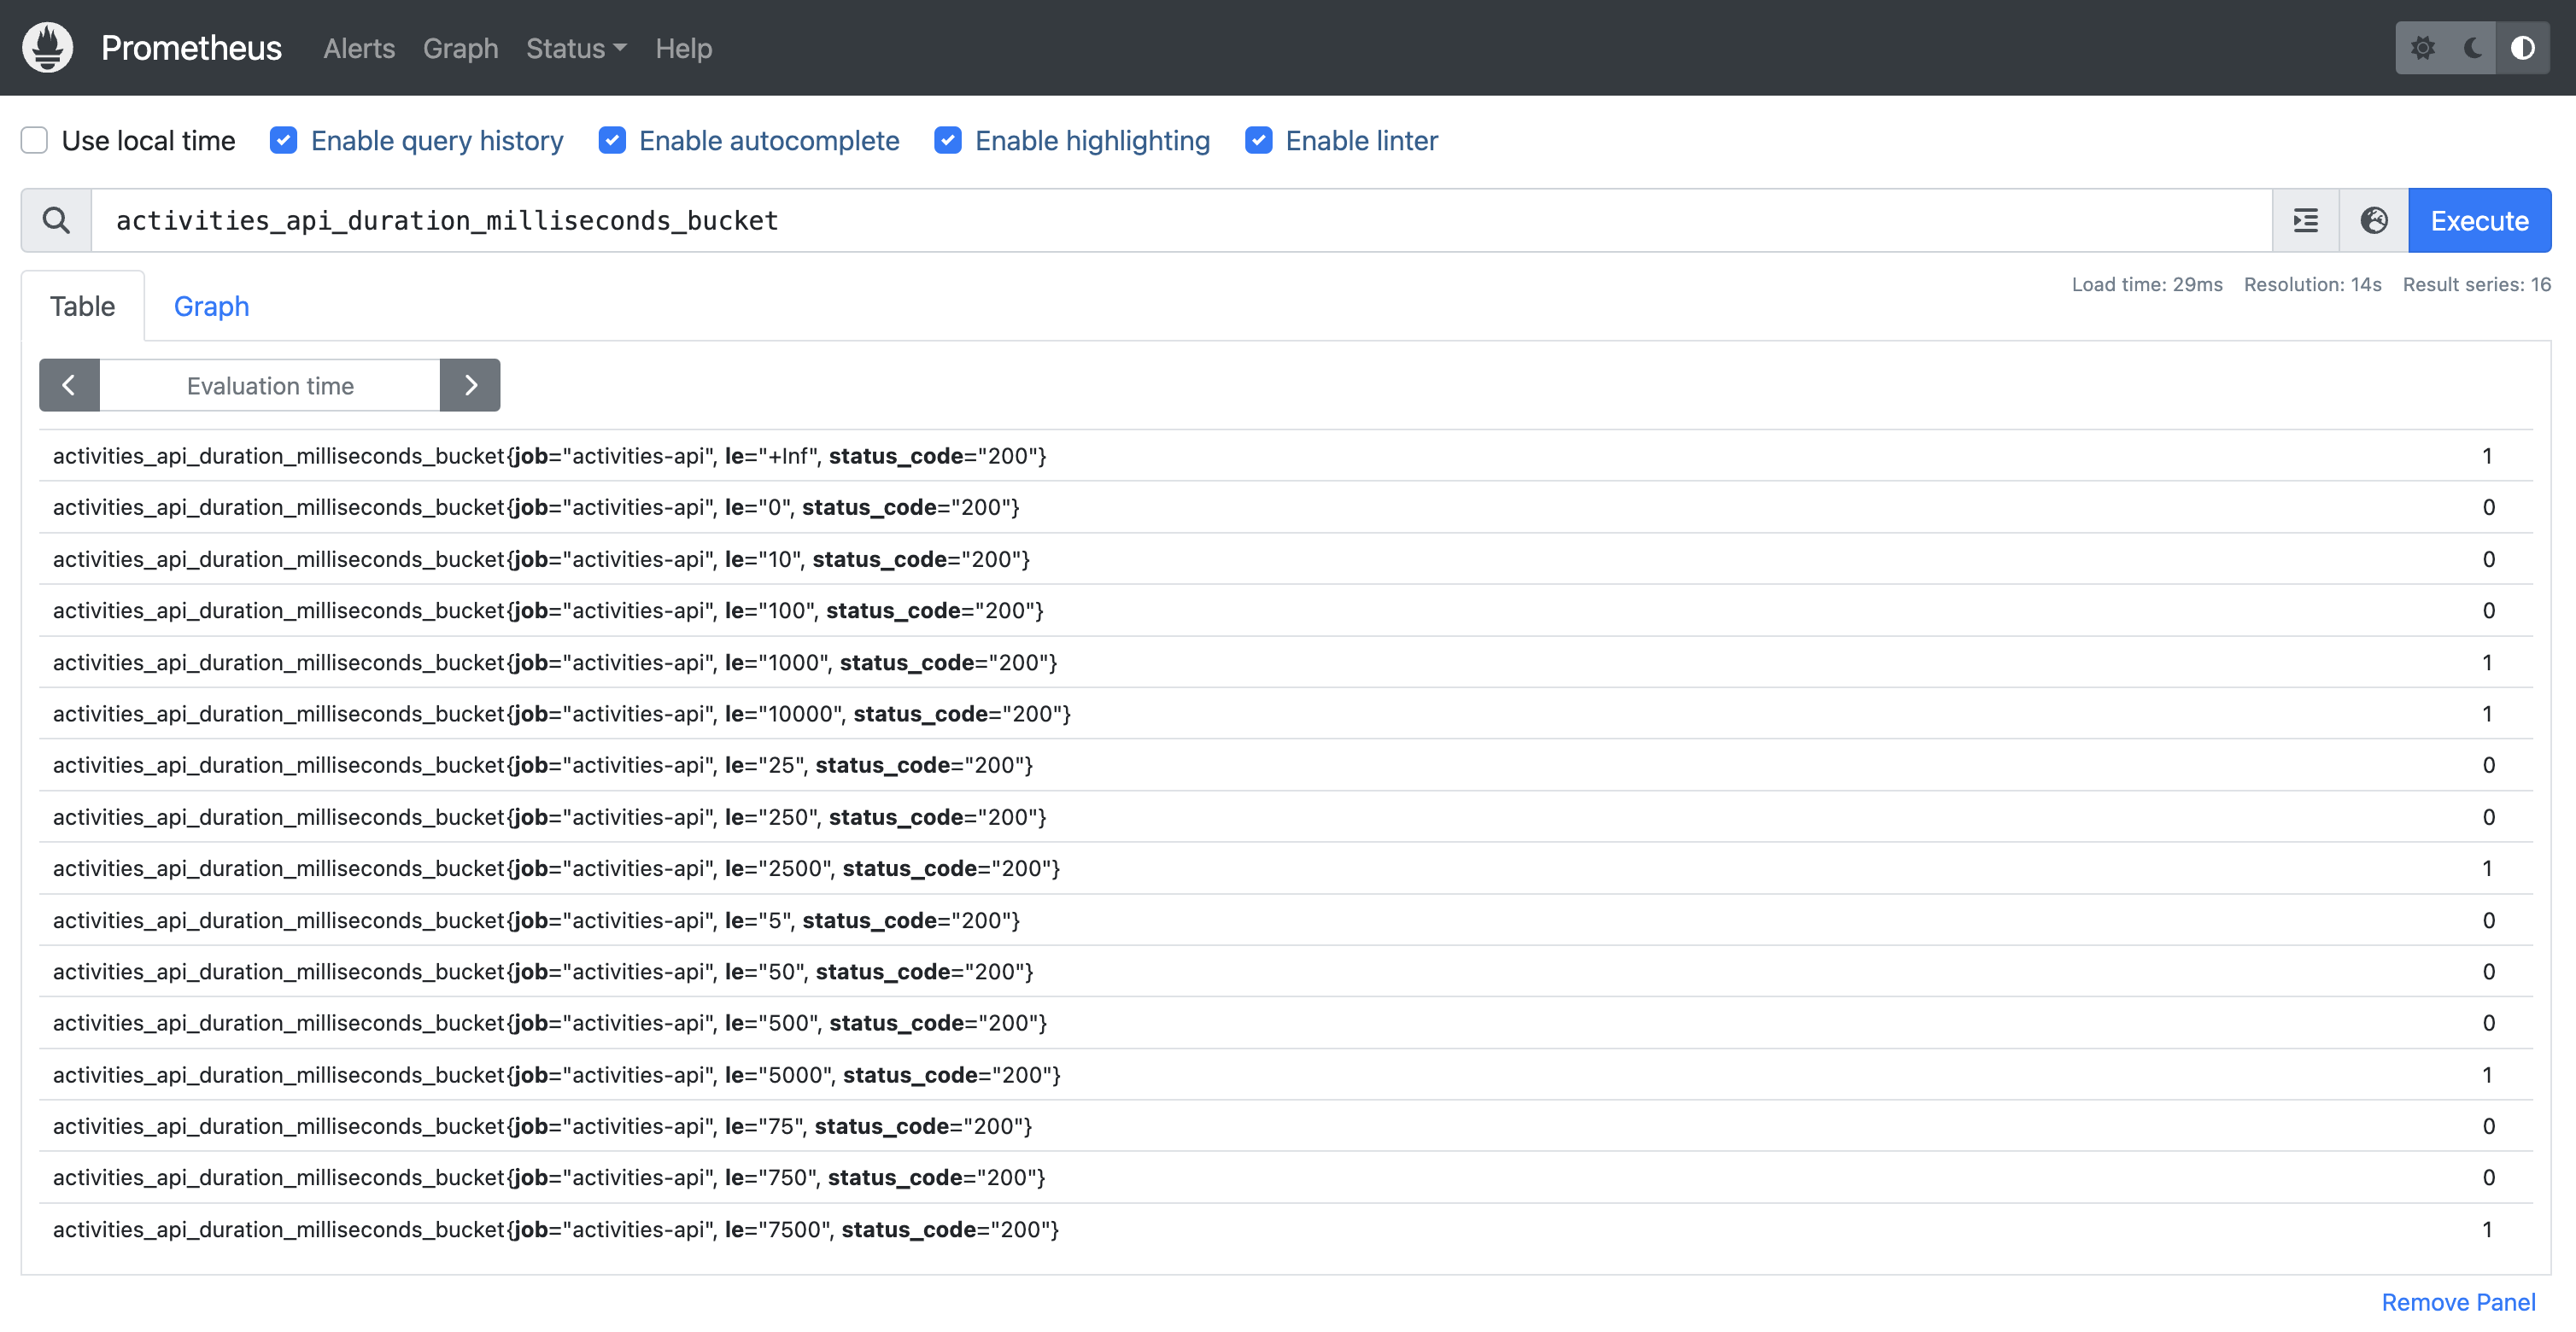
For our Activities API metrics, since it is not behind an Ingress, we can retrieve its metrics from Prometheus
directly.
Go to your browser and type http://prometheus.localhost. On the search bar, you'll see 3 metrics:
activities_api_duration_milliseconds_[bucket|sum|count]
Conclusion
OpenTelemetry can be a complex observability framework that comes with a set of tools, SDKs and APIs. It is powerful and can increase visibility on your SLOs by not only using traditional metrics but also combining traces and logs altogether.
The collector is a great agent to centralise observability for your platform so your team and other developers can efficiently publish application data.
It is versatile and vendor-agnostic. It supports a wide variety of receivers, exporters and processors to fiddle with your data on the fly before being sent.