Instrument your Golang code with custom metrics.
Introduction
As an SRE, sometimes we need to build applications to glue components together so that the business can get overall end to end feedback.
In occasions, such applications are not RestAPIs that expose an endpoint behind an Ingress. Therefore, we can't
retrieve the metrics from our ingress controller, and we must instrument our application to see relevant metrics.
In this article, I am going to use Bored's free API to create a small use case. The code will be instrumented and metrics can be queried in Prometheus so that those can be plotted in Grafana.
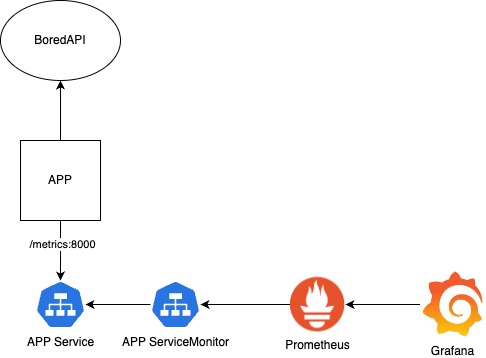
High level architecture
The app will request an activity from Bored, and it will send a notification to a user if the activity is suitable for at least n participants.
We will use Prometheus' client to enable a /metrics endpoint to our app and expose our metrics.
App code
Starting off with our metrics package, it creates a histogram metric with a label status_code
and exposes a /metrics endpoint so Prometheus can scrape it.
package metrics

import (
    "net/http"

    "github.com/prometheus/client_golang/prometheus"
    "github.com/prometheus/client_golang/prometheus/promhttp"
)

var BoredApiDurationHistogram = prometheus.NewHistogramVec(
    prometheus.HistogramOpts{
        Name:    "bored_api_request_duration",
        Help:    "Duration of request in seconds",
        Buckets: prometheus.LinearBuckets(0.1, 0.1, 10),
    },
    []string{"status_code"},
)

func StartServer() {
    prometheus.MustRegister(BoredApiDurationHistogram)
    http.Handle("/metrics", promhttp.Handler())
    http.ListenAndServe(":8000", nil)
}
As for our app, it creates an Activity struct to model the response JSON and if the activity's participants are
greater than the argument number (2), it would send a notification to a user.
Notification method is not implemented here, and we log every request to the API.
package main

import (
    "encoding/json"
    "fmt"
    "io"
    "log"
    "net/http"
    "src-go/metrics"
    "time"
)

type Activity struct {
    Activity      string  `json:"activity"`
    Type          string  `json:"type"`
    Participants  int     `json:"participants"`
    Price         float32 `json:"price"`
    Link          string  `json:"link"`
    Key           string  `json:"key"`
    Accessibility float32 `json:"accessibility"`
}

func getActivityByParticipants(p int) {
    start := time.Now()

    url := "https://www.boredapi.com/api/activity"

    resp, err := http.Get(url)

    if err != nil {
        log.Fatal(err)
    }

    defer resp.Body.Close()
    body, err := io.ReadAll(resp.Body)

    var result Activity

    if err := json.Unmarshal(body, &result); err != nil {
        log.Println("Error while decoding JSON", err)
    }

    end := time.Now()
    elapsed := end.Sub(start)

    metrics.BoredApiDurationHistogram.WithLabelValues(
        fmt.Sprintf("%d", resp.StatusCode)).Observe(elapsed.Seconds())

    if result.Participants >= p {
        log.Println(result)
        // Send notification to user here...
    }
}

func main() {
    go metrics.StartServer()
    for true {
        getActivityByParticipants(2)
    }
}
Kubernetes resources
After we create our Docker image with our app, we need a Deployment, Service and ServiceMonitor.
Make sure that all the labels match, otherwise the ServiceMonitor won't show up.
apiVersion: v1
kind: Service
metadata:
  labels:
    app: metrics-example-go
  name: metrics-example-go
  namespace: metrics-deployment
spec:
  ports:
  - name: metrics
    port: 8000
    protocol: TCP
    targetPort: metrics
  selector:
    app: metrics-example-go
  type: ClusterIP
---
apiVersion: apps/v1
kind: Deployment
metadata:
  labels:
    app: metrics-example-go
  name: metrics-example-go
  namespace: metrics-deployment
spec:
  selector:
    matchLabels:
      app: metrics-example-go
  template:
    metadata:
      labels:
        app: metrics-example-go
    spec:
      containers:
      - image: registry.localhost/fabreteca/metrics-example-go
        imagePullPolicy: Always
        livenessProbe:
          failureThreshold: 3
          httpGet:
            path: /metrics
            port: metrics
          initialDelaySeconds: 5
          periodSeconds: 10
        name: metrics-example-go
        ports:
        - containerPort: 8000
          name: metrics
        readinessProbe:
          failureThreshold: 3
          httpGet:
            path: /metrics
            port: metrics
          initialDelaySeconds: 5
          periodSeconds: 10
        resources:
          limits:
            cpu: 100m
            memory: 150Mi
          requests:
            cpu: 100m
            memory: 150Mi
---
apiVersion: monitoring.coreos.com/v1
kind: ServiceMonitor
metadata:
  labels:
    app: metrics-example-go
  name: metrics-example-go
  namespace: metrics-deployment
spec:
  endpoints:
  - port: metrics
    scrapeTimeout: 10s
  namespaceSelector:
    any: true
  selector:
    matchLabels:
      app: metrics-example-go
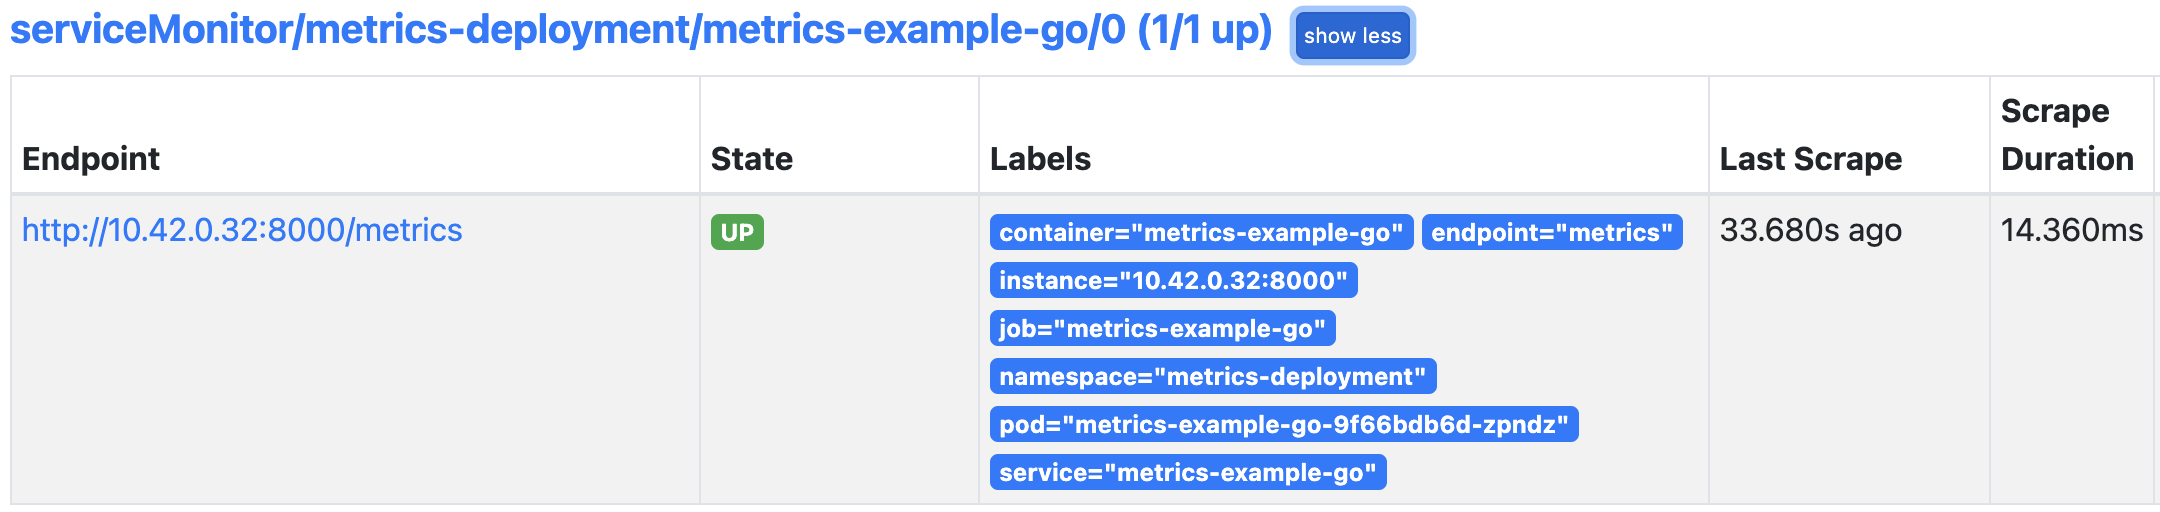
Putting it together
Once our app is running and the ServiceMonitor available, our Prometheus instance should see it as a target.
And we should see 3 metrics:
bored_api_request_duration_bucket: cumulative counters for the observation buckets.bored_api_request_duration_count: the count of events that have been observed.bored_api_request_duration_sum: the total sum of all observed values.
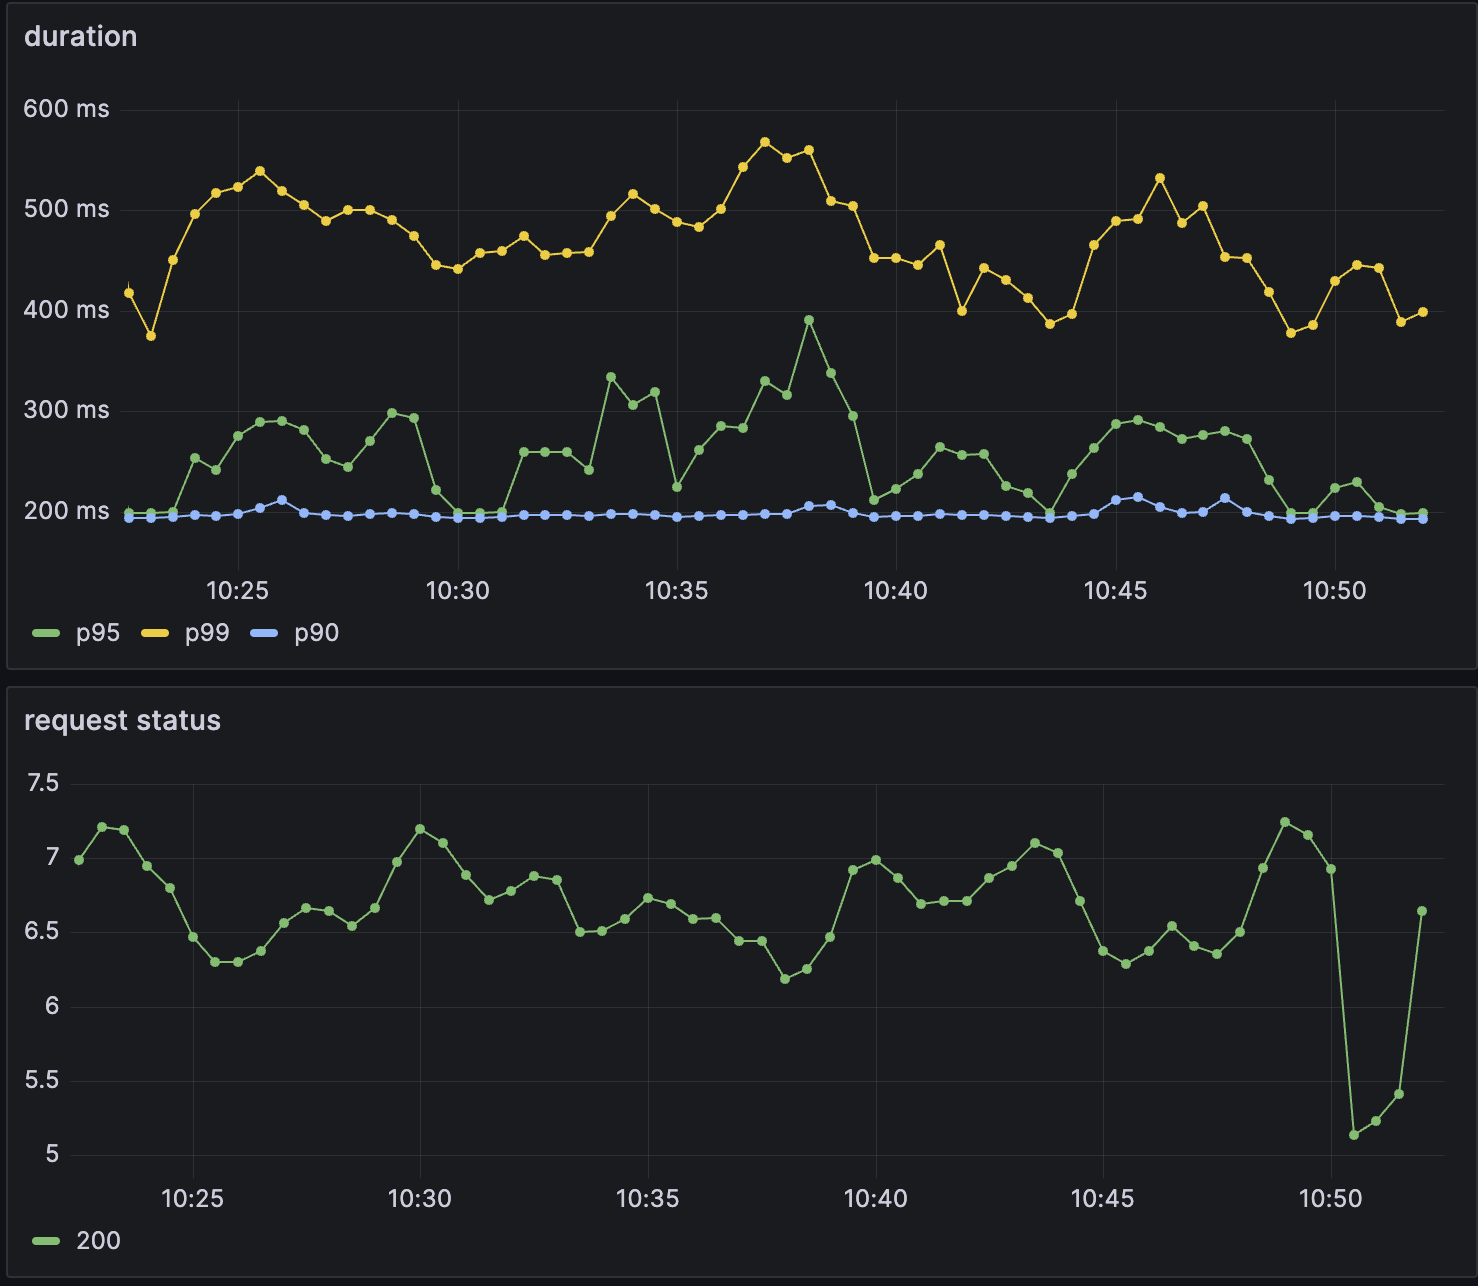
In order to plot them in a meaningful way, we can create a Grafana dashboard with different percentiles.
histogram_quantile(0.90, sum(rate(bored_api_request_duration_bucket[$__rate_interval])) by (le))
histogram_quantile(0.95, sum(rate(bored_api_request_duration_bucket[$__rate_interval])) by (le))
histogram_quantile(0.99, sum(rate(bored_api_request_duration_bucket[$__rate_interval])) by (le))
Conclusion
We saw a straightforward way of instrumenting our code and expose metrics for our team. It will give us insight about performance and reliability of the service. The data is useful to get alerts on certain thresholds that we define as well as having error budgets in place.